Hana Benchetrit 1, Mohammad Jaber 1, Valery Zayat 1, Shulamit Sebban 1, Avital Pushett 1, Kirill Makedonski 1, Zvi Zakheim 1, Ahmed Radwan 1, Noam Maoz 1, Rachel Lasry 1, Noa Renous 1, Michal Inbar 1, Oren Ram 2, Tommy Kaplan 3, Yosef Buganim 4
Abstract
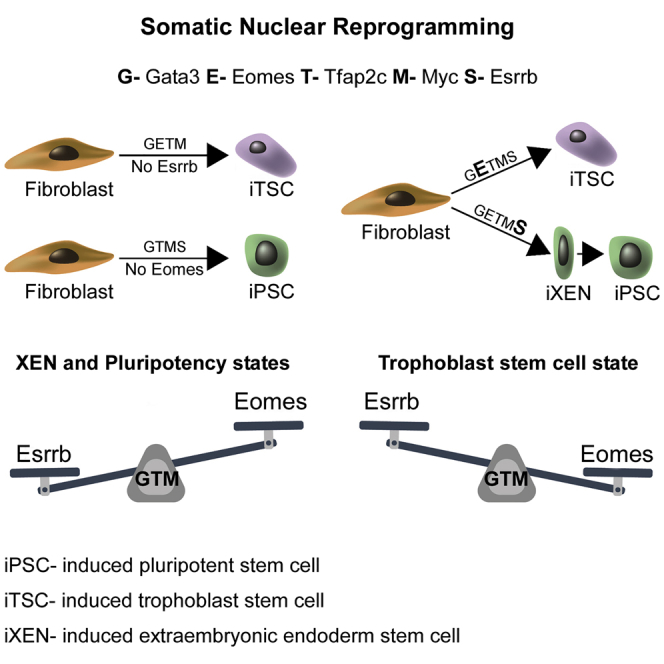
Following fertilization, totipotent cells undergo asymmetric cell divisions, resulting in three distinct cell types in the late pre-implantation blastocyst: epiblast (Epi), primitive endoderm (PrE), and trophectoderm (TE). Here, we aim to understand whether these three cell types can be induced from fibroblasts by one combination of transcription factors. By utilizing a sophisticated fluorescent knockin reporter system, we identified a combination of five transcription factors, Gata3, Eomes, Tfap2c, Myc, and Esrrb, that can reprogram fibroblasts into induced pluripotent stem cells (iPSCs), induced trophoblast stem cells (iTSCs), and induced extraembryonic endoderm stem cells (iXENs), concomitantly. In-depth transcriptomic, chromatin, and epigenetic analyses provide insights into the molecular mechanisms that underlie the reprogramming process toward the three cell types. Mechanistically, we show that the interplay between Esrrb and Eomes during the reprogramming process determines cell fate, where high levels of Esrrb induce a XEN-like state that drives pluripotency and high levels of Eomes drive trophectodermal fate.
Keywords: Eomes; Esrrb; early embryonic development; induced extraembryonic endoderm stem cells; induced pluripotent stem cells; induced trophoblast stem cells; inner cell mass; primitive endoderm; reprogramming; trophectoderm.
Copyright © 2019 The Author(s). Published by Elsevier Inc. All rights reserved.
See this image and copyright information in PMC
Graphical abstract

See this image and copyright information in PMC
Figure 1
Esrrb Drives TSC Reprogramming with GETM to Pluripotency (A) Schematic representation, bright field and fluorescence images of the 3 PSC reporters (left), 3 TSC reporters (right), and FACS analysis of the 4 reporters in BYKE-MEFs undergoing reprogramming for 20 days with OSKM (left) or GETM (right) followed by 10 days of dox removal. (B) BYKE-MEFs were infected with GETM plus individual factors as indicated and tested for iPSC formation. The graph summarizes FACS analysis of the 3 PSC reporters in BYKE-MEFs undergoing reprogramming for 20 days with GETM plus the indicated single factor, followed by 10 days of dox removal. A typical experiment out of 3 independent experiments is shown. (C) BYKE-MEFs were reprogrammed by GETM + Esrrb (GETMS) for 20 days with dox followed by 2 days of dox removal. Subsequently, different populations of cells (Utf1-2A-tdTomato+/Esrrb-2A-TagBFP-/Nanog-2A-EGFP- and Utf1-2A-tdTomato+/Esrrb-2A-TagBFP+/Nanog-2A-EGFP+) were sorted and tested for expression of ESC-specific (Oct4 and Nanog), TSC-specific (Elf5 and Cdx2), and trophoblast differentiation-specific (Gcm1, Ctsq, and Tpbpa) genes. mRNA levels were normalized to Gapdh. Error bars presented as a mean ± SD of 2 duplicate runs from a typical experiment out of 3 independent experiments. (D and E) FACS analyses for the 4 reporters on BYKE-MEFs undergoing reprogramming with GETMS for 20 days followed by 10 days of dox removal under (D) ESC (GETMS-ESM) or (E) TSC (GETMS-TSM) culture conditions. (F) (Left) Reprogramming strategy for producing both iPSCs and iTSCs with GETMS factors. (Right) FACS analysis of the 4 reporters in BYKE-MEFs undergoing reprogramming with GETMS following the aforementioned reprogramming strategy. (G) qPCR of the GETMS transgenes normalized to Gapdh in BYKE-GETMS#10 2°MEFs after 72 h of dox induction. Error bars presented as a mean ± SD of 2 duplicate runs from a typical experiment out of 3 independent experiments. (H and I) Graphs summarizing FACS analyses for all 4 reporters (H) and representative bright field and fluorescence images (I) after 20 days of dox followed by 10 days of dox removal of BYKE-GETMS#10 2°MEFs infected with additional single factor as depicted in ESC or TSC medium. Error bars presented as a mean ± SD of 2 duplicate runs from a typical experiment out of 3 independent experiments. Related to Figure S1.
See this image and copyright information in PMC
Figure 2
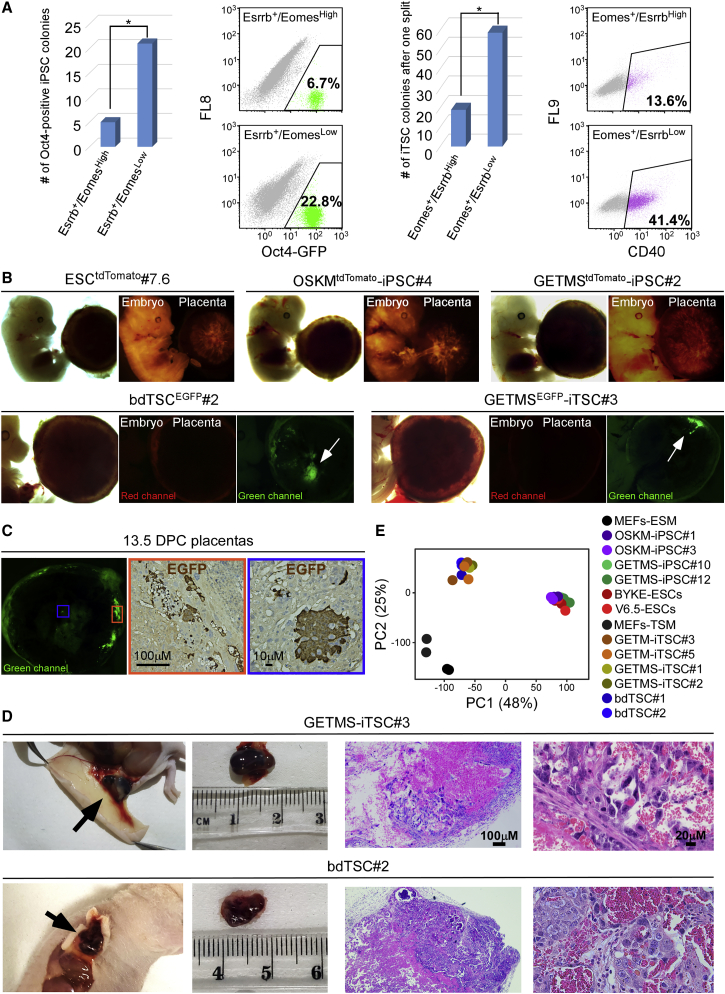
GETMS-iPSCs and GETMS-iTSCs Are Fully Functional (A) (Left) Oct4-GFP MEFs were infected with GETMS factors, with Esrrb marked by EGFP and Eomes marked by tdTomato. 6 days post-dox induction, 16,000 of Esrrb-EGFP-positive and Eomes-tdTomato-high cells or 16,000 of Esrrb-EGFP-positive and Eomes-tdTomato-low cells were sorted and plated on feeder cells. Reprogramming continued for 20 more days in ESC medium followed by 10 days of dox removal. Left: number of Oct4-GFP-positive iPSC colonies is shown. Right: FACS analysis of Oct4-GFP-positive cells is shown. (Right) Oct4-GFP MEFs were infected with GETMS factors, with Eomes marked by EGFP and Esrrb marked by tdTomato. 6 days post-dox induction, 80,000 of Eomes-EGFP-positive and Esrrb-tdTomato-high cells or 80,000 of Eomes-EGFP-positive and Esrrb-tdTomato-low cells were sorted and plated on feeder cells. Reprogramming continued for 20 more days in TSC medium followed by 10 days of dox removal and one split for colony stabilization. Left: number of iTSC colonies is shown. Right: FACS analysis for the trophoblast-specific cell surface marker, Cd40, is shown. Asterisk indicates p ≤ 0.05 using Student’s t test. (B) tdTomato-marked ESC, OSKM-iPSC, GETMS-iPSC, and EGFP-marked bdTSC and GETMS-iTSC clones were injected into blastocysts. The resulting embryos and placentas were analyzed at 13.5 DPC. Bright field, red and green channel images of the chimeric embryos and placentas are depicted. (C) Immunofluorescent and immunohistochemical staining images of 13.5-DPC chimeric placenta showing a clear EGFP signal in the central and marginal areas (marked by blue and orange rectangles, respectively) following GETMSEGFP-iTSCs injection. (D) (Left) Hemorrhagic lesions 6 to 7 days following subcutaneous injection of the indicated GETMS-iTSC and bdTSC lines. (Right) H&E staining of paraffin sections of hemorrhagic lesions shows necrotic tissue with blood and scattered trophoblastic cells. (E) PCA of global gene expression profiles from RNA-seq data of two biological replicates of 2 MEF, 2 OSKM-iPSC, 2 GETMS-iPSC, 2 ESC, 2 GETM-iTSC, 2 GETMS-iTSC, and 2 bdTSC lines. Related to Figure S2.

See this image and copyright information in PMC
Figure 3
Unbiased Comparative Transcriptome and Chromatin Analysis of the Various Reprogramming Combinations (A) PCA of global gene expression profiles from RNA-seq data of two biological replicates of MEFs, bdTSCs, ESCs, and the indicated reprogramming combinations after 72 h of dox induction. (B) PCA of the same samples as in (A), excluding bdTSCs and ESCs. (C) Clustering and heatmap of transcriptional differences detected by RNA-seq for the indicated groups, showing 13,309 expressed genes (FPKM > 2 in at least one condition) grouped into 19 clusters. Blue (0) denotes no expression, and yellow (1) denotes maximal expression. (D) Clustering and heatmap of all (n = 188,432) intronic and distal ATAC-seq peaks of the indicated samples in 18 clusters exhibiting variation across all samples. Heatmap colors correspond to maximal ATAC-seq signal for every peak across 8 conditions, ranging from 0 (purple) to 20 (green) reads (normalized). (E and F) UCSC genome browser visualization of normalized ATAC-seq profiles (top) and RNA-seq levels in FPKM (bottom) at the Gdf3 (E) or Elf5 (F) locus in the indicated samples. Data from two merged biological replicates are shown. Colored rectangles indicate condition(s) (cell type[s] or reprogramming combination[s])-specific regions. (G) Transcription factor binding motifs that were identified by comparing the top distal and intronic ATAC-seq peaks in GETMS and GTMS to those in GETM. (H) Venn diagram showing the overlaps between differentially expressed genes (upregulated) in the present study (GETMS versus MEFs), 8 lines of chemically induced XENs versus MEFs (Li et al., 2017), 4 lines of OSKM-induced XENs grown in ESC medium versus MEFs (Parenti et al., 2016), and intermediate cells on days 26 and 28 during chemical reprogramming versus MEFs (Zhao et al., 2015). The significance of the overlap between the present study and the respective study is indicated. (I) Heatmap visualization of 96 differentially expressed genes shared between the present study and at least one of the 3 studies mentioned above. Related to Figure S3.

See this image and copyright information in PMC
Figure 4
GETMS Combination or Esrrb Overexpression during ESC-TSC Transdifferentiation Produces Stable iXENs (A) Bright field and immunostaining images for Gata6 (magenta), Sox17 (green), and Dapi (blue) in GETMS-derived induced XEN stem cells (GETMS-iXENs) grown on feeder cells. (B) FACS analysis showing the percentage of GFP-positive cells for Oct4-GFP MEFs that were reprogrammed for 20 days, followed by 6 days of dox removal, with GETMS together with either empty vector (EV), Gata6, Sox17, or both. (C and D) Oct4-GFP MEFs were reprogrammed for 20 days, followed by 10 days of dox removal, with GETMS together with either an empty vector (EV), Sox17, Gata6, or Sox17 and Gata6. Subsequently, 100,000 GFP-positive cells were sorted from each group and analyzed. qPCR analysis for PSC-specific genes, Nanog and Fgf4 (C), and XEN-specific genes, Pdgfr and Sra6 (D), normalized to Gapdh in the indicated samples is shown. Error bars presented as a mean ± SD of 2 duplicate runs from a typical experiment out of 3 independent experiments. (E) qPCR of the indicated genes normalized to Gapdh during transdifferentiation of ZHBTc4 ESCs into TS-like cells at the indicated time points after infection with either constitutively active Eomes or Esrrb. Day 0 refers to pre-dox induction. Error bars presented as a mean ± SD of 2 duplicate runs from a typical experiment out of 3 independent experiments. (F) Western blot analysis detecting Esrrb and actin in ZHBTc4 cell lines harboring Esrrb-KD (EsrrbHypomorph), Esrrb overexpression (EsrrbOE), or control (EsrrbWT). (G) ChIP-qPCR for Esrrb in ZHBTc4 cells harboring WT (EsrrbWT), knockdown (EsrrbHypomorph), or overexpression (EsrrbOE) of Esrrb. A graph depicting the binding intensity of Esrrb to the indicated loci in all conditions as measured by the fold change of DNA enrichment between control antibody (Igg) and Esrrb antibody is shown. All samples were normalized to their corresponding input. Error bars presented as a mean ± SD of 2 duplicate runs from a typical experiment out of 3 independent experiments. Related to Figure S4.