Yosef Buganim 1, Styliani Markoulaki 2, Niek van Wietmarschen 3, Heather Hoke 4, Tao Wu 5, Kibibi Ganz 2, Batool Akhtar-Zaidi 2, Yupeng He 6, Brian J Abraham 2, David Porubsky 3, Elisabeth Kulenkampff 2, Dina A Faddah 4, Linyu Shi 2, Qing Gao 2, Sovan Sarkar 2, Malkiel Cohen 2, Johanna Goldmann 2, Joseph R Nery 6, Matthew D Schultz 6, Joseph R Ecker 6, Andrew Xiao 5, Richard A Young 7, Peter M Lansdorp 8, Rudolf Jaenisch 9
Abstract
Induced pluripotent stem cells (iPSCs) are commonly generated by transduction of Oct4, Sox2, Klf4, and Myc (OSKM) into cells. Although iPSCs are pluripotent, they frequently exhibit high variation in terms of quality, as measured in mice by chimera contribution and tetraploid complementation. Reliably high-quality iPSCs will be needed for future therapeutic applications. Here, we show that one major determinant of iPSC quality is the combination of reprogramming factors used. Based on tetraploid complementation, we found that ectopic expression of Sall4, Nanog, Esrrb, and Lin28 (SNEL) in mouse embryonic fibroblasts (MEFs) generated high-quality iPSCs more efficiently than other combinations of factors including OSKM. Although differentially methylated regions, transcript number of master regulators, establishment of specific superenhancers, and global aneuploidy were comparable between high- and low-quality lines, aberrant gene expression, trisomy of chromosome 8, and abnormal H2A.X deposition were distinguishing features that could potentially also be applicable to human.
Figures
See this image and copyright information in PMC
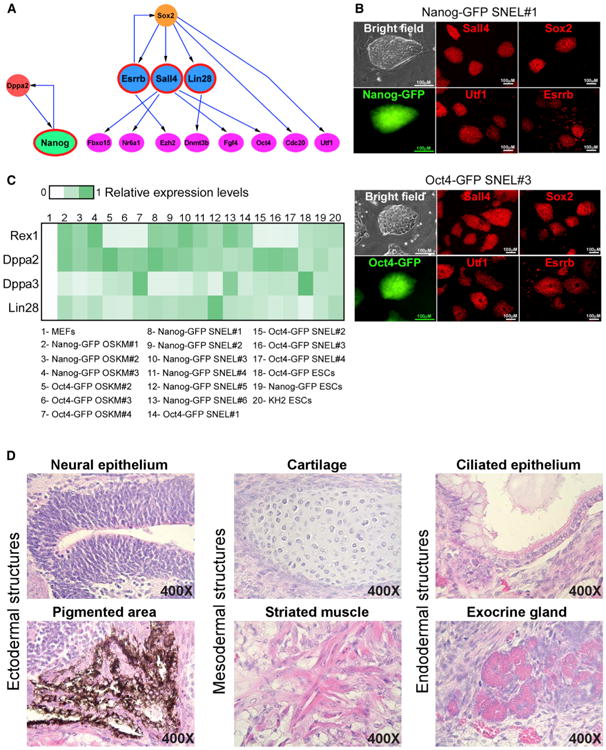
Figure 1. Characterization of SNEL-iPSC Lines
(A) Schematic presentation of Bayesian network demonstrates the hierarchy of a subset of pluripotent genes that leads to a stable and transgene independent pluripotency state (Buganim et al., 2012). Sall4, Nanog, Esrrb, and Nanog (SNEL) are marked by a red circle. (B) Representative images of two stable dox-independent, GFP-positive colonies (Nanog-GFP SNEL#1 and Oct4-GFP SNEL#3) and immunostaining for Sall4, Sox2, Utf1, and Esrrb. (C) Heatmap demonstrating the relative expression levels of Dppa3, Dppa2, Zfp42 (Rex1), and Lin28 normalized to the Hprt housekeeping control gene in the indicated samples. (D) Hematoxylin and eosin staining of teratoma sections generated from Oct4-GFP SNEL#1 showing structures from all three layers. See also Figure S1.
See this image and copyright information in PMC
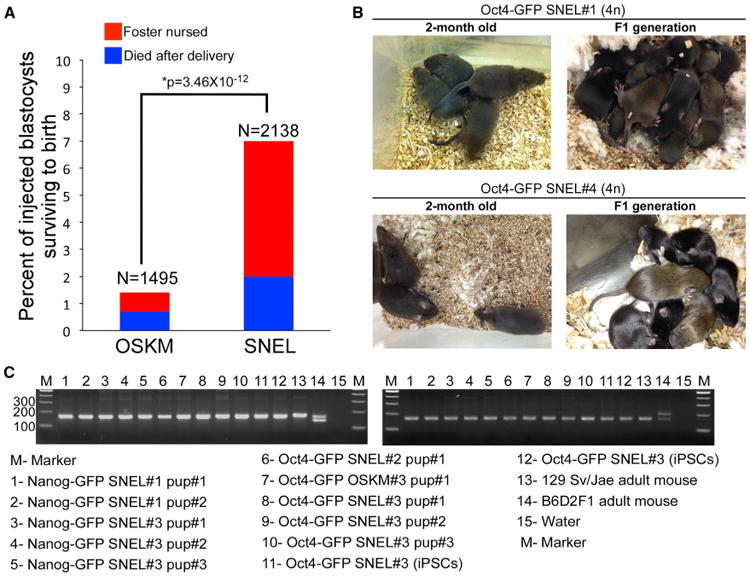
Figure 2. SNEL-iPSCs Produce “All-iPSC” Mice with High Success Rates as Compared to OSKM
(A) Percent of injected blastocysts surviving to birth are plotted for OSKM and SNEL lines, with the number of blastocysts noted on the x axis. Blue represents the number of pups that merely survived delivery, red the number of pups additionally foster-nursed. Percentages were compared by χ2 test to compute significance. (B) Representative images of 4n adult mice produced from Oct4-GFP SNEL#1 and Oct4-GFP SNEL#4 lines and their F1 generation. (C) Confirmation of origin of “all-iPSC” mice by PCR for strain-specific polymorphisms. Two different simple sequence polymorphism (SSLP) markers were tested using genomic DNA isolated from tissues of “all-iPSC” mice. Genomic DNA from the parental iPSCs (donor cells), a 129 Sv/Jae mouse (donor strain), and a B6D2F1 mouse (host blastocyst strain) served as controls. See also Figure S2.
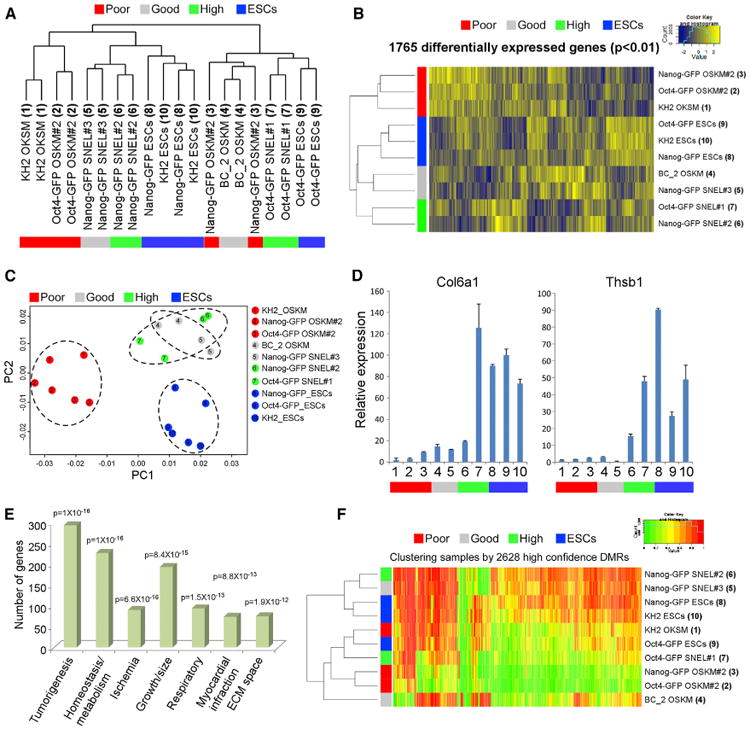
Figure 3. Unbiased Comparative Transcriptome Analyses Distinguish iPSCs According to Their 4n Proficiency (A) Hierarchical clustering of global gene expression profiles for two microarray technical replicates for every iPSC and ESC (reference) line. Replicate pairs were assigned a shared numerical value. (B) Hierarchical clustering of all genes (n = 1,765) exhibiting significant variation (p < 0.01 by F test) across all ESC and iPSC samples. (C) Principle component analysis for genes from (B). Each of the iPSC and ESC groups is marked by specific color and is surrounded by a circle. The numbers inside the circles correspond to the numbers in (A). (D) qRT-PCR of the Col6a1 and Thsb1 normalized to the Hprt housekeeping control gene in the indicated samples. Error bars are presented as a mean ± SD of two duplicate runs from a typical experiment. The numbers on the x axis correspond to the numbers in (A). (E) Gene ontology analysis using the GeneDecks (Stelzer et al., 2009) algorithm of genes from (A). (F) Hierarchical clustering of 2,628 differentially methylated regions (DMRs) derived from whole genome bisulfite sequencing does not segregate samples by either reprogramming factor combinations or ESC versus iPSC status. Each group (poor, good, high, and ESCs) is marked by a different color. Sample numbers correspond to the numbers in (A). See also Figure S3.
See this image and copyright information in PMC
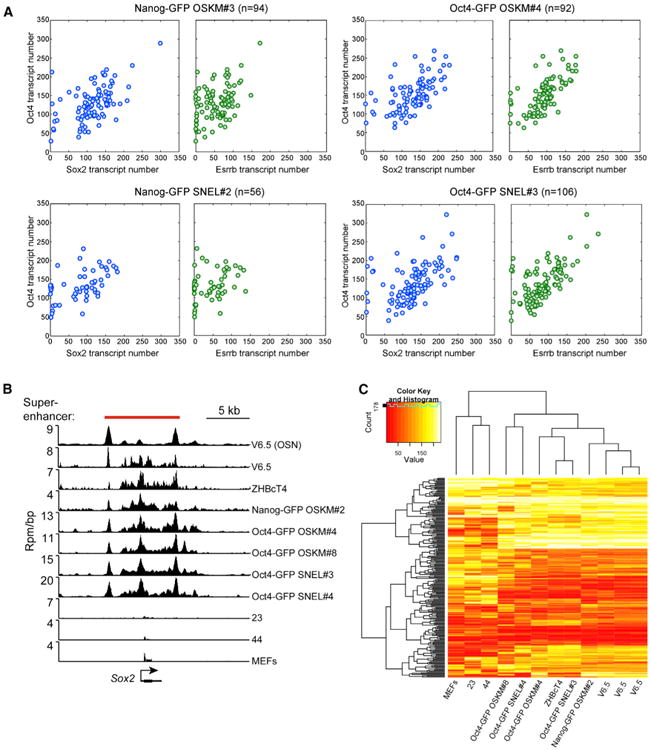
Figure 4. The Transcript Number of Key Master Regulators and the Establishment of ESC-Specific Superenhancers Are Comparable between Poor- and High-Quality iPSCs
(A) sm-mRNA-FISH experiments depict the transcript number of Oct4 versus Sox2 and Oct4 versus Esrrb in single cells from the indicated iPSC lines. n, represents the number of single cells analyzed. (B) ChIP-seq binding profiles for Oct4, Sox2, and Nanog (merged, OSN) in V6.5 mESCs and Med1 for the indicated cell lines at the Sox2 locus. Location of the superenhancer, as defined in V6.5 mESCs (Whyte et al., 2013), is indicated by the red bar. Rpm/bp, reads per million per base pair. (C) Hierarchical clustering of Med1 densities in superenhancers recapitulates phylogeny of cell types. ChIP-seq read densities for Med1 were calculated in mES superenhancers. Clustering these densities indicates that cell types of similar origin have similar signal of Med1 in superenhancers. All ChIP-seq was performed with a Bethyl Laboratories antibody (A300-793A, lot A300-783A), except for the farthest right V6.5 ChIP, which was performed with a Santa Cruz Biotechnology antibody (SC-5334X, lot A1112). See also Figure S4.
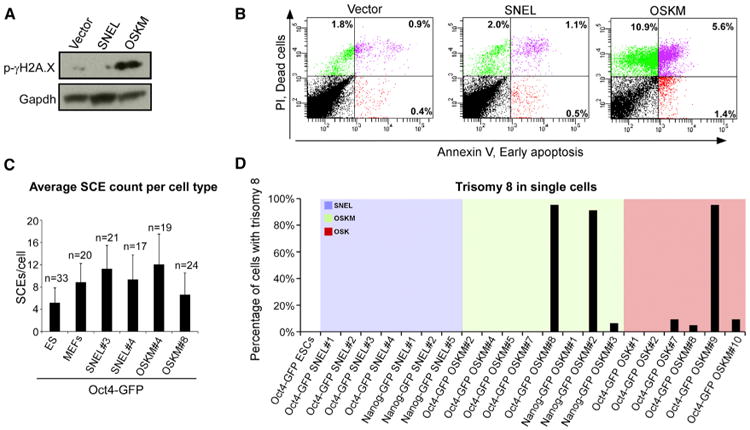
Figure 5. Trisomy of Chromosome 8 Is a Frequent Genomic Aberration in Poor-Quality OSK/OSKM-iPSCs (A) Western blot analysis for the DNA damage sensor, γ-H2A.X phosphorylation, and the housekeeping control protein Gapdh, 7 days postdox exposure in MEFs infected with the indicated dox-inducible reprogramming factors. (B) FACS analyses demonstrating the percentage of cells from (A) that initiated the apoptotic process as assessed by PI and Annexin V. (C) Graph summarizing the average number of sister chromatid exchanges (SCEs) occurring at the single cell level in the indicated lines using the Strand-seq technique. n, represents the number of single cells tested. Error bars are presented as a mean ± SD of the indicated “n” examined single cells. (D) Graph summarizing the frequency of trisomy 8 observed in the indicated colonies. See also Figure S5.
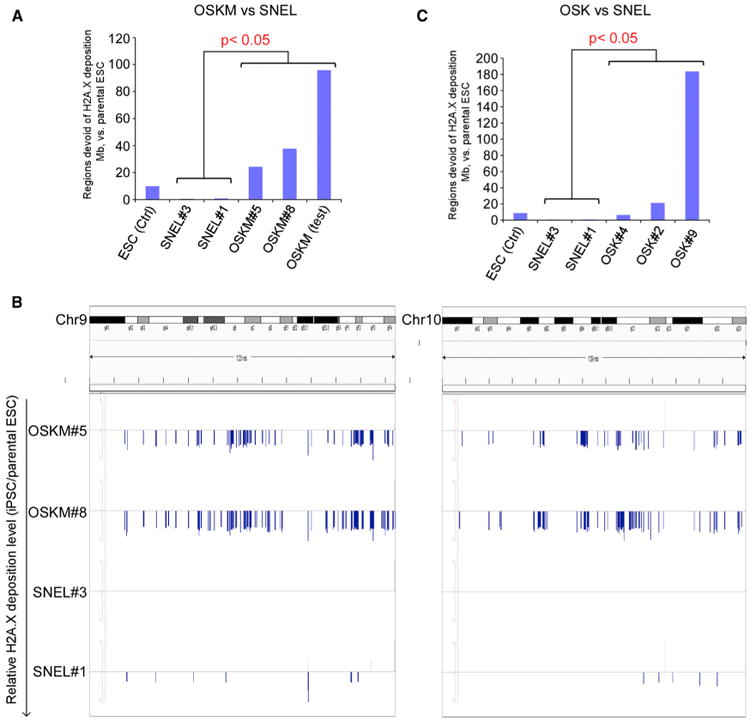
Figure 6. H2A.X Deposition Pattern Can Distinguish SNEL and OSK or OSKM iPSC Lines (A) The bar chart illustrates that the genome coverage of defective H2A.X deposition regions in OSKM-iPSC lines (n = 3) are significantly higher than those in 4N+ SNEL-iPSC lines (n = 2) or the ESC control line (p value < 0.05, Wilcoxon rank sum test). (B) Comparative H2A.X depositions in SNEL iPSC and OSKM iPSC at two chromosomes (left: Chr9; right: Chr10). y axis: relative H2A.X deposition level (RSEG score, as compared to the ESC parental line, see Experimental Procedures). Positive value: regions enriched for H2A.X deposition over control (gray bars); negative values: regions devoid of H2A.X deposition over control (blue bars). (C) The bar chart illustrates that the genome coverage of H2A.X defective deposition regions in OSK-iPSC lines are significantly higher than those in SNEL-iPSC lines (n = 2) (p value < 0.05, Wilcoxon rank sum test).